
Is It Clean: Protecting Public Health Across New England
How we built a real-time water quality platform serving millions of recreational water users

Project Takeaways
Active Monitoring Sites
Samples processed since 2009
Partner Organizations
Volunteers Engaged
Our original “Is It Clean” website launched the year I started as a volunteer in the lab at CRC, so it is a project that I have been close to my whole career. I’m so excited that we are finally able to bring this project into the modern era, taking advantage of technology that simply wasn’t available in 2013. I've had a vision for a while about how Is It Clean could be a tool that helps users interpret data in meaningful ways in addition to providing the data itself and this project was finally able to bring that vision to life while updating it. Behind the scenes, this project has helped develop and refine our water quality data management system which we hope to replicate with other programs within our organization.

Project Deployment Strategy
Working in partnership with Connecticut River Conservancy (CRC), The Commons developed a comprehensive data management system for water quality monitoring samples collected by CRC staff and partner organizations. The platform integrates seamlessly with Webflow and Mapbox to deliver an intuitive, mobile-responsive website that provides real-time water safety forecasts across hundreds of recreational sites throughout New Hampshire, Connecticut, Vermont, and Massachusetts. The fully configurable system empowers CRC staff with administrative control while maintaining a robust development environment that facilitates seamless collaboration between software developers and designers.

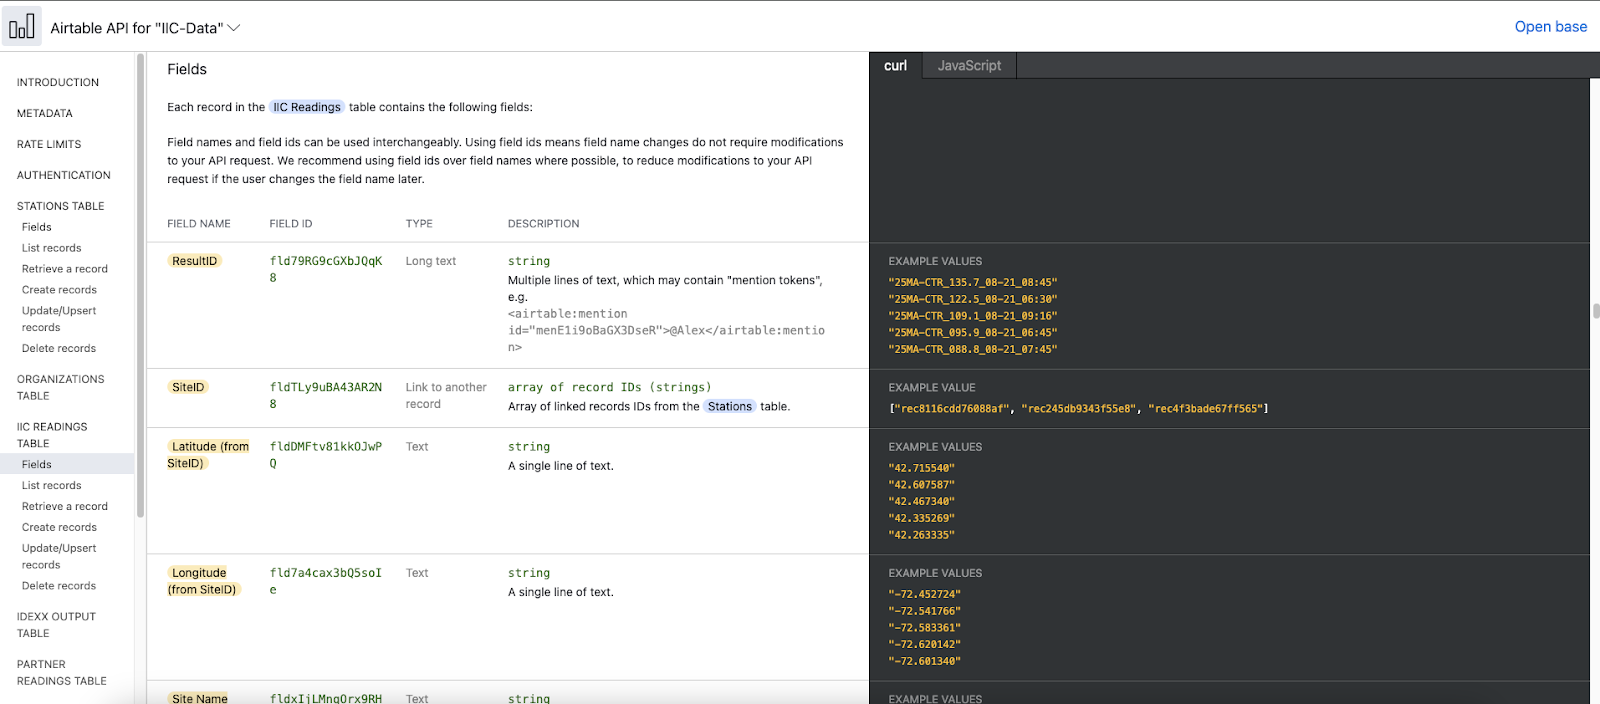
AirTable | Data Management
Working with Connecticut River Conservancy staff, The Commons deployed an program-specific AirTable Bases to facilitate easy collection and management of community shared water quality monitoring samples.

Mapbox | Location Experience
Leveraging Mapbox, our team deployed an integrated web mapping experience that displays current monitoring site conditions and allows for easy routing to monitoring site pages.

Webflow | Content Management
Our team chose Webflow for its ease of maintenance and designer-friendly development environment. Webflow's powerful CMS and API enabled real-time site updates and seamless synchronization with Airtable.
.png)
Notion | Documentation
Using Notion, we created SOPs and living documentation to ensure CRC staff can easily manage "Is It Clean," maintain the technology stack, and build autonomous capabilities independent of our development team.
Training and Support
Throughout the lifecycle of the project, our team grew proficiency amongst CRC staff to full fully operate, maintain, and extend the deployed system with limited developer intervention.
Project and Environmental Policy Intersection
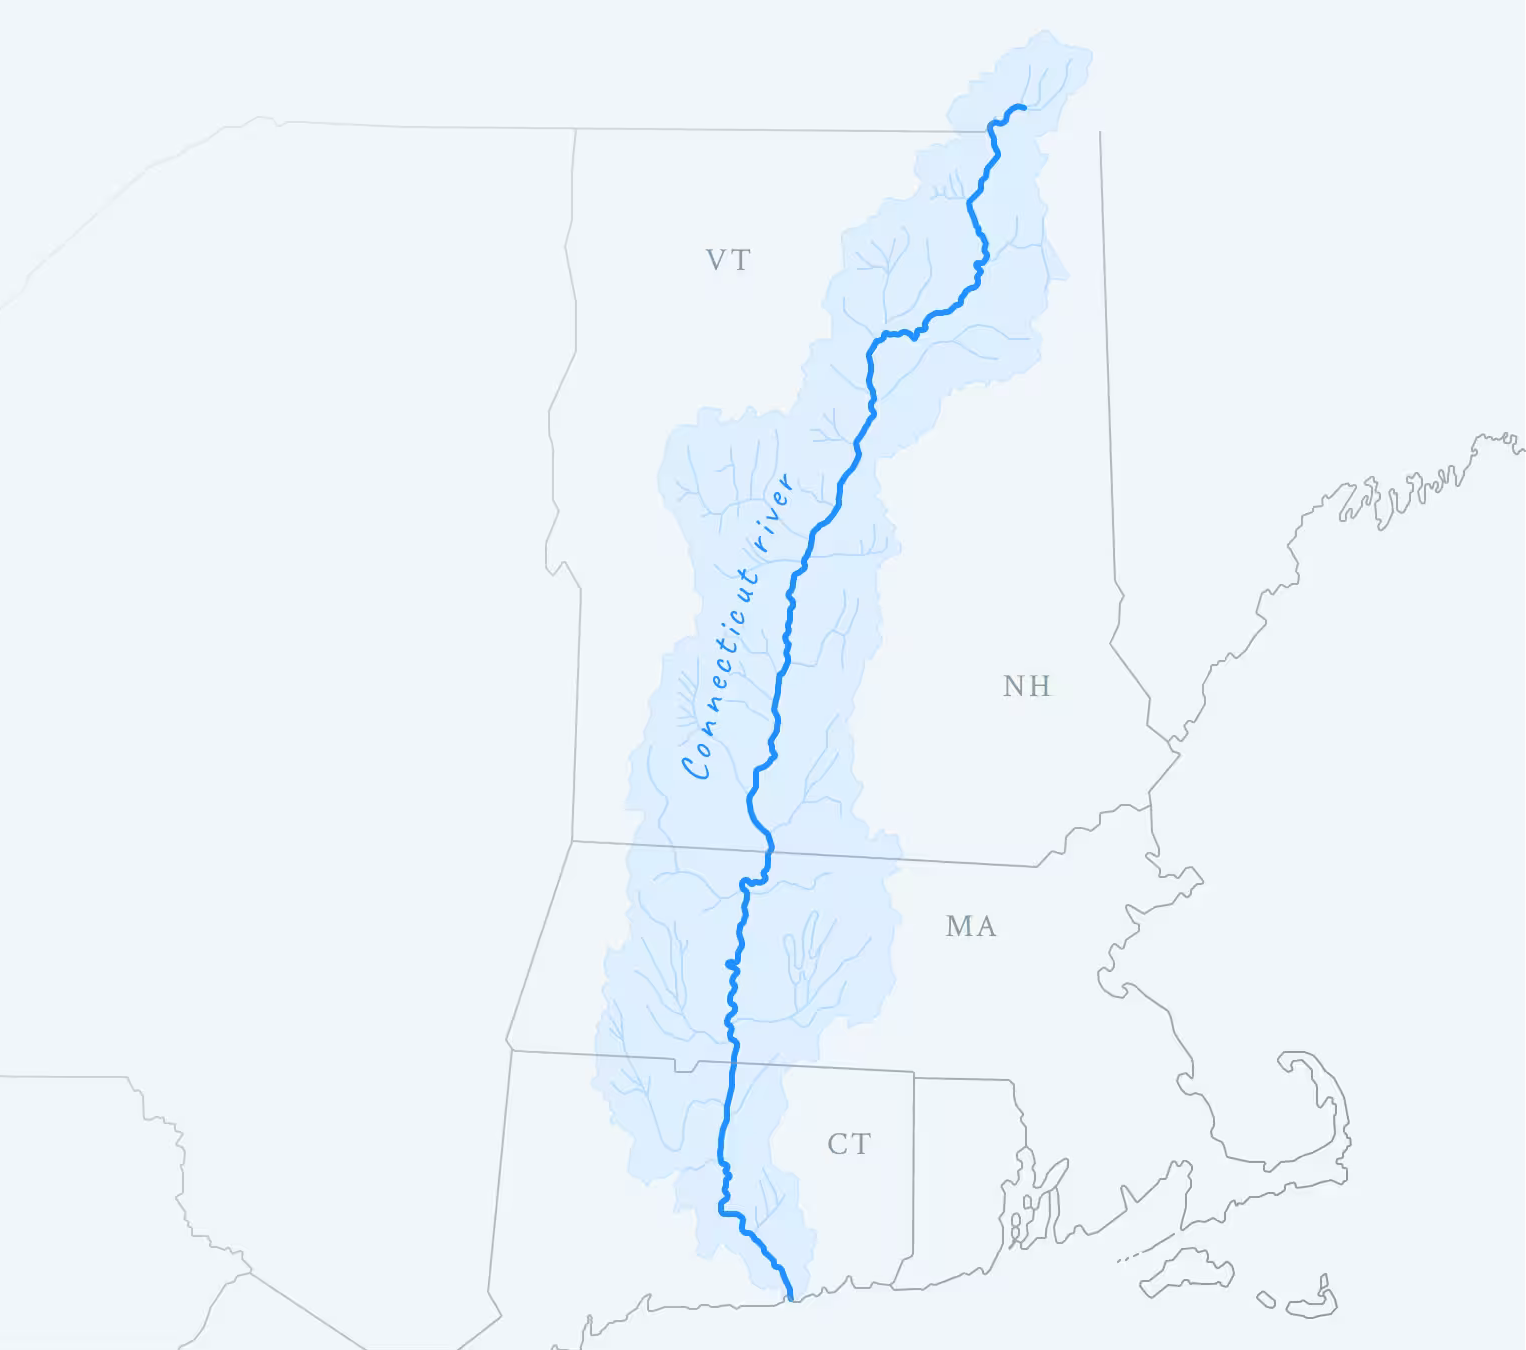
The Connecticut River watershed spans 11,260 square miles across four states—New Hampshire, Vermont, Massachusetts, and Connecticut—serving as home to over 2.4 million people and hosting some of New England's most treasured recreational waterways. Despite significant improvements since the passage of the Clean Water Act in 1972, the watershed continues to face complex environmental challenges that threaten public health and recreational safety. Combined sewer overflows (CSOs) from aging infrastructure release millions of gallons of untreated sewage directly into the Connecticut River during heavy rainfall events, while stormwater runoff from increasingly urbanized areas carries harmful bacteria and pollutants into waterways. The Massachusetts and Connecticut portion of the Connecticut River is impacted by five remaining CSO communities, all of which have been working for decades to reduce CSO discharges. The Metropolitan District alone achieved a 50% reduction in yearly overflows between 2006 and 2022, eliminating 488 million gallons in total.
Under federal Clean Water Act mandates and EPA's CSO Control Policy, municipalities with combined sewer systems must implement long-term control plans and maintain NPDES permits for their discharges. The CSO Control Policy established a national framework for controlling CSOs in a flexible, cost-effective manner, requiring communities to identify minimum controls and develop long-term plans to achieve compliance with water quality standards. However, in these communities, bacteria levels during storm events remain unsafe for swimming and boating, creating an urgent need for real-time public health information that enables recreational users to make informed safety decisions.
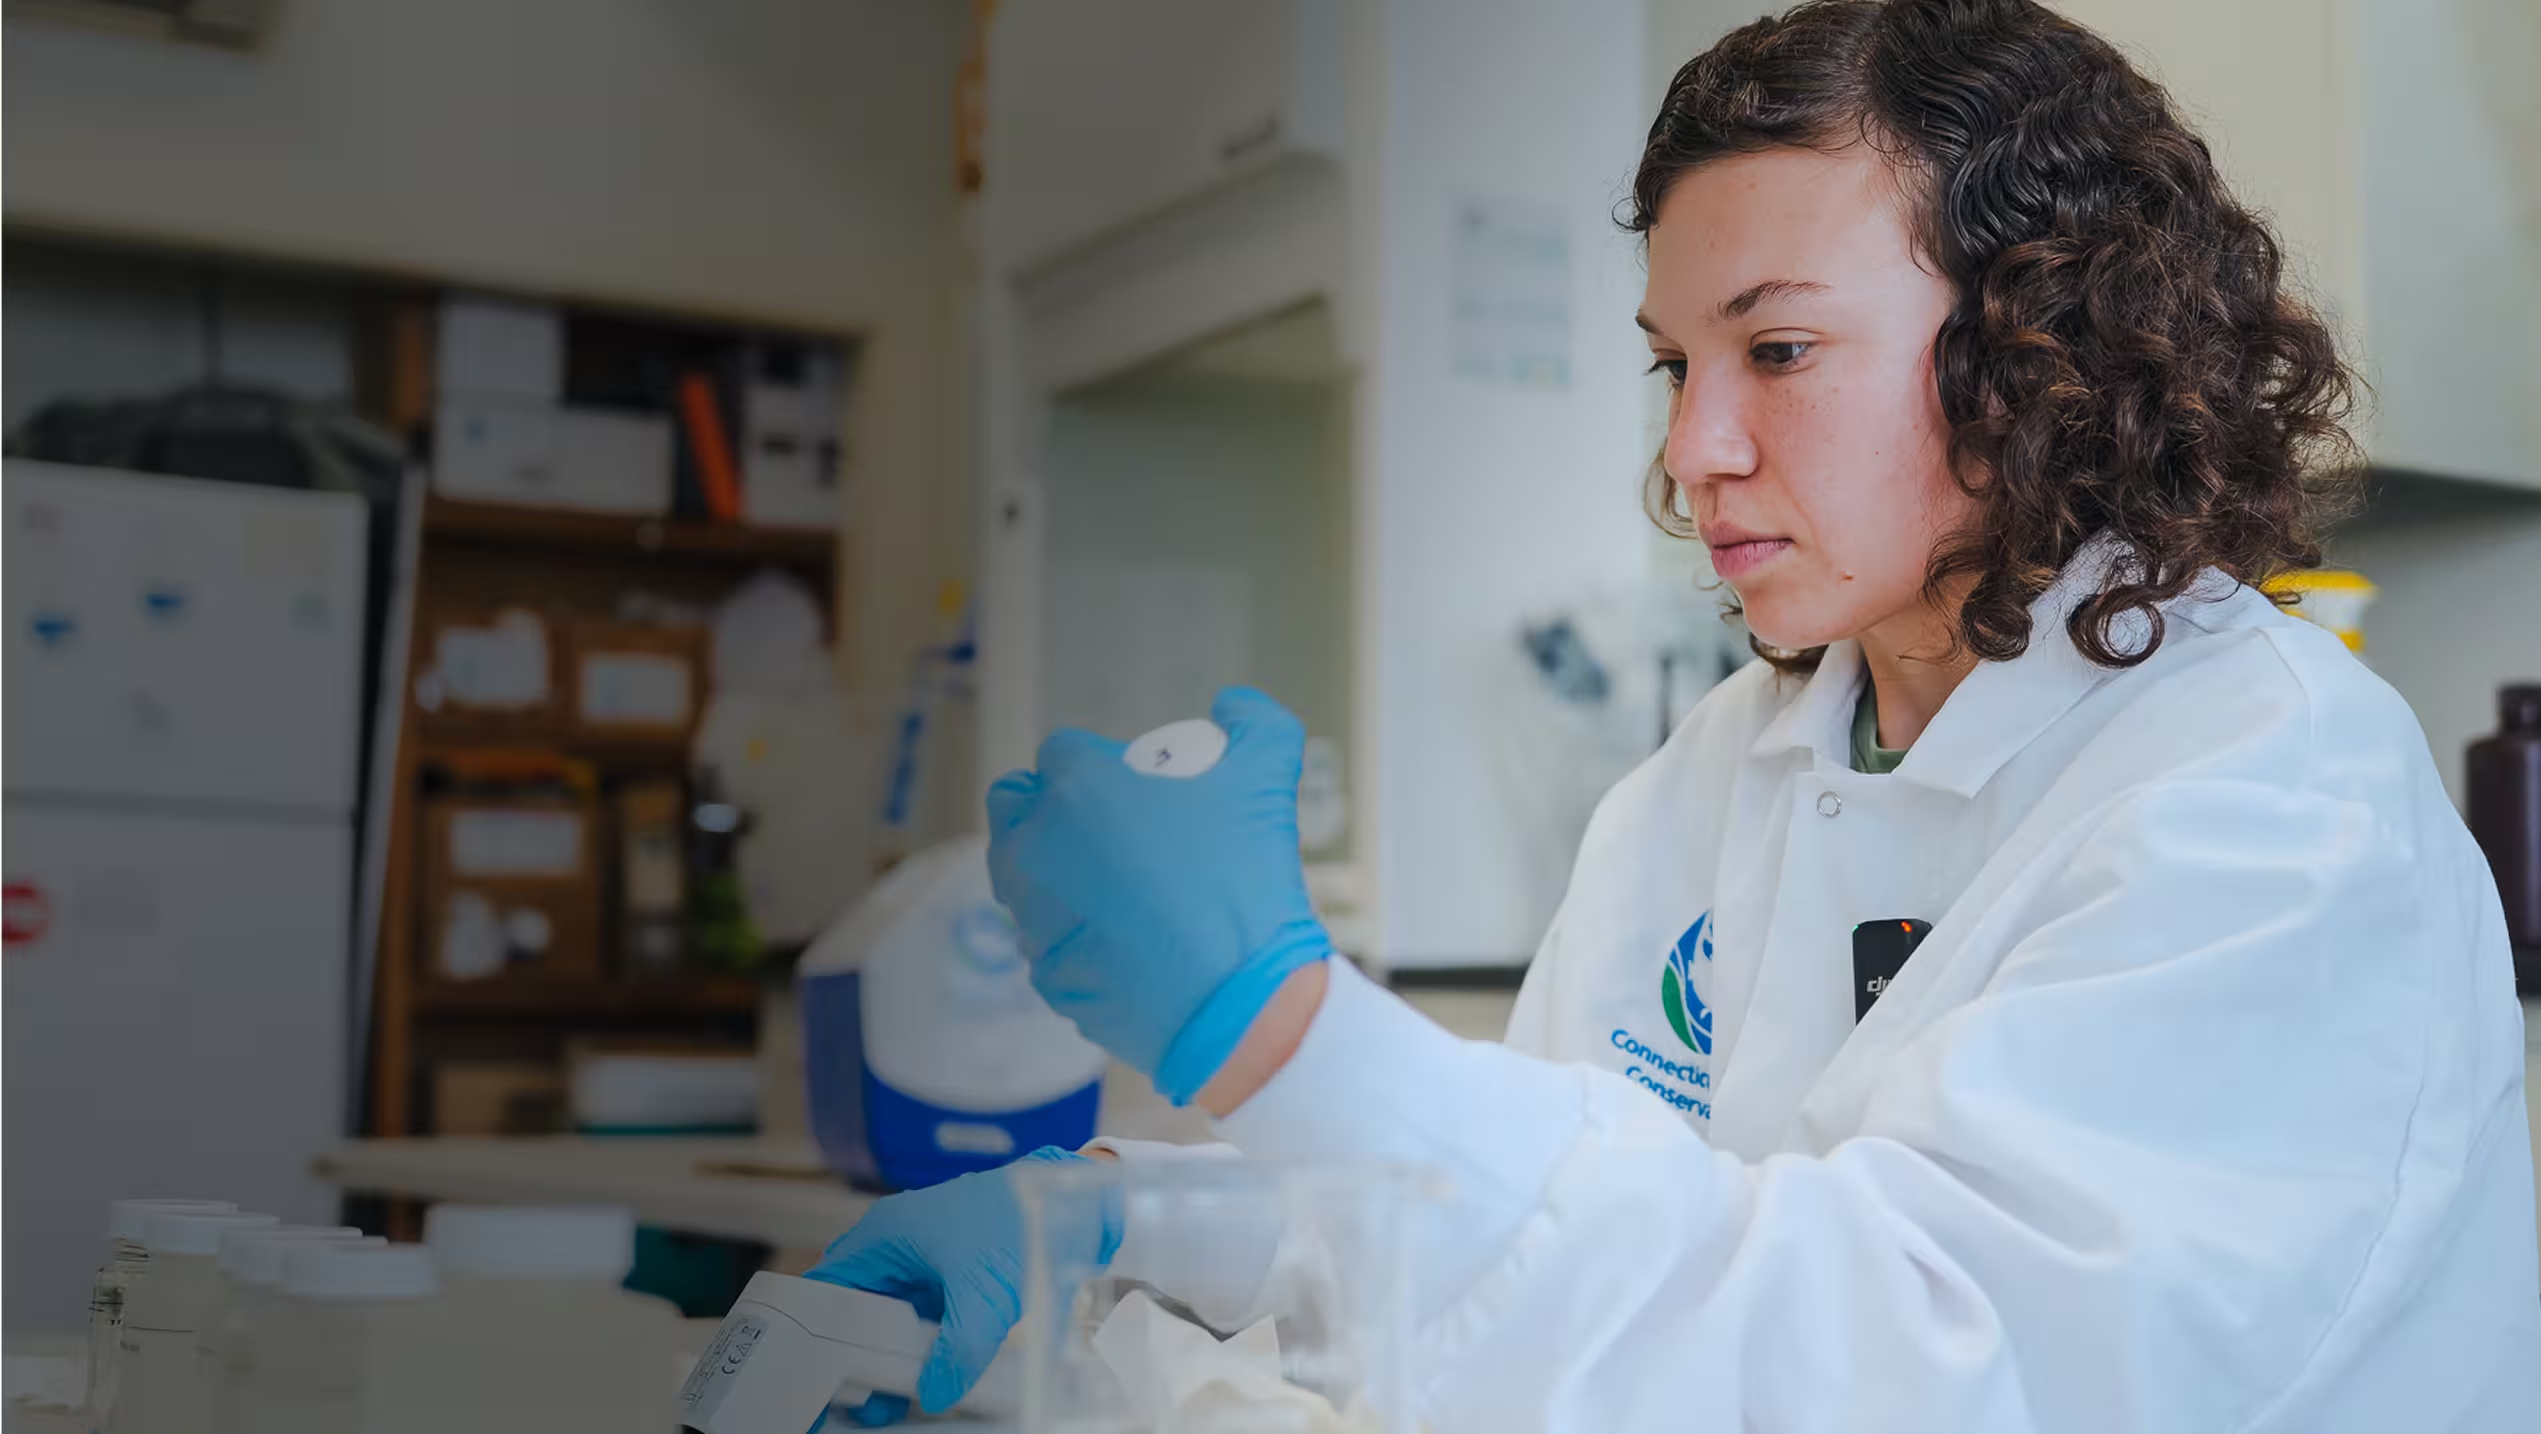
To provide this critical information, the Connecticut River Conservancy (CRC) established itself as the leading environmental advocate and water quality monitor for the region, coordinating with over 15 watershed partners to collect and analyze water samples across 140+ recreational sites. CRC's water quality monitoring program provides vital scientific information to help the public and local, state, and federal partners better understand river health. Data collected by volunteers and staff helping inform advocacy, restoration, and recreation access work. Volunteers collect samples weekly from twenty-two locations across Massachusetts, Connecticut, and Vermont, with results classified by wet or dry weather conditions to indicate whether runoff is influencing bacteria levels.
Recognizing that complex laboratory E. coli readings and technical water quality data were largely inaccessible to recreational river users, CRC partnered with The Commons to develop the “Is It Clean” platform. What makes this effort truly extraordinary is its foundation in community-driven science—water samples are collected by dozens of localized volunteer groups and watershed residents throughout New Hampshire, Vermont, Massachusetts, and Connecticut, creating an unprecedented on-the-ground information pipeline that connects directly to the people who live, work, and recreate along these waterways - ensuring that the data collected is not only scientifically valuable but also immediately relevant to the communities it serves . Water sample results from these dedicated volunteers are uploaded to the “Is it Clean?”/”¿Está Limpio?” website, where users can access bacteria results to make informed decisions about where to safely swim, boat, or recreate based on EPA recreational water quality standards. The platform transforms complex E. coli measurements into intuitive color-coded safety guidance that translates regulatory thresholds for primary contact recreation (swimming) and secondary contact recreation (boating) into immediate, actionable information for families planning a day at the river. This comprehensive digital infrastructure bridges the critical gap between scientific water quality monitoring and practical public health decision-making, empowering watershed communities with the real-time data they need to enjoy their rivers safely.
Project Planning
CRC’s bacteria monitoring program began as an opportunity for the organization to provide watershed communities with accessible, real-time water quality information across more than 250 active monitoring sites spanning four states. With an extensive network of volunteer groups collecting water samples from dozens of locations and limited staff capacity for data management, the program needed a streamlined approach that could transform complex laboratory E. coli readings into immediate, actionable safety guidance for recreational river users. The existing Drupal-based platform faced significant limitations including cumbersome manual data upload processes that created versioning issues when CRC administrators needed to constantly upload full partner datasets, an interface that made it difficult for users to quickly identify specific recreation sites, and no notification system to alert users when water conditions changed at their preferred locations.

Working directly with CRC staff, our team executed comprehensive project planning by conducting a full UI/UX audit and review to identify the core functionalities that would result in an ideal user experience. Through this collaborative process, we established four main requirements that would need to be met for a modernized “Is It Clean” platform. First, the system needed an intuitive interface that allowed recreational users to quickly find their preferred swimming or boating locations and understand current safety conditions through clear, color-coded guidance based on EPA recreational water quality standards. Second, accessibility was identified as paramount, requiring Spanish language translation capabilities and support for color blind users to ensure equitable access to critical public health information. Third, CRC staff and partner organizations needed streamlined data management workflows that would eliminate manual upload processes and versioning conflicts while maintaining data integrity across the multi-partner network. Finally, users needed the ability to sign up for specific site notifications so they could receive alerts when water quality conditions changed at their preferred recreational locations.
To meet these requirements, The Commons developed a strategic approach that leveraged low/no code services to create a comprehensive digital ecosystem. We identified UI/UX requirements and then built an index of cloud-based software solutions that could support each element of the platform's functionality. For data management, we selected Airtable to serve as the centralized database, providing CRC staff with intuitive data organization tools while supporting automated workflows that would eliminate manual upload processes. Mapbox was chosen for development of the site's primary interactive mapping interface, offering robust geospatial capabilities and a robust developer environment for customization options essential for displaying water quality data across the vast multi-state watershed. Finally, Webflow was selected for the content management system and overall site design, providing the flexibility needed to create an accessible, multilingual platform while maintaining the visual clarity and mobile responsiveness necessary for effective public health communication. This hybrid SaaS approach enabled rapid development while ensuring long-term maintainability and scalability for CRC's staff and expanding volunteer monitoring network.
Methodology
The core component of this project was the development of a comprehensive public-facing platform that could transform complex water quality data from dozens of volunteer monitoring groups into immediate, actionable recreational safety guidance for watershed communities. Our methodology prioritized collaborative design, automated data management, and intuitive user experience to ensure the platform would serve both technical and non-technical users across four states. The “Is It Clean” platform contains the following features:
- Intuitive, color-coded mapping interface displaying real-time water quality conditions at 140+ recreational sites
- Multilingual accessibility including Spanish translation and color blind-friendly design elements
- Advanced filtering capabilities allowing users to quickly identify preferred swimming or boating locations
- Dedicated partner organization pages showcasing the breadth of the volunteer monitoring network
- Individual monitoring site pages with detailed historical data and recreational access information
- Real-time USGS flow data integration providing environmental context for E. coli readings
- Automated notification system alerting users when conditions change at their preferred locations
- Mobile-responsive design ensuring accessibility across all device types
We chose Figma as our primary design tool, utilizing its collaborative features to conduct comprehensive stakeholder workshops with CRC staff throughout the design process. Figma allowed our team to iterate quickly while transparently compiling and reviewing a full market assessment of similar patterns from water quality monitoring sites as well as weather applications and websites. Through systematic analysis of comparable platforms, we identified proven UI/UX patterns that could be adapted for water quality communication. Our design process progressed through low, medium, and high fidelity mockups, ensuring all stakeholders were aligned on exactly what the new Is It Clean site would look like when finished. This iterative approach allowed CRC staff to provide ongoing feedback and enabled our team to make revisions quickly at the point of discovery.

Close collaboration remained a core component of our development strategy throughout the project. CRC stakeholders had access to design iterations at every stage, allowing their team to provide continuous input based on their deep understanding of both the technical water quality data and the recreational user needs across the watershed.
Our data management approach leveraged CRC's existing investment in Airtable, where they had been maintaining complex data associated with all water quality monitoring sites, site attributes, and core metadata from their in-house laboratory. We developed a phased integration strategy that utilized Airtable's base syncing and automation functionality to automatically stage the necessary CRC and partner samples and sites for integration with the Is It Clean platform. Using a series of low-code automations that continuously monitor changes in the Airtable base, data is instantly synced with the “Is It Clean” platform hosted in Webflow. This automated sync updates Webflow's powerful CMS Collections module, ensuring that the latest water quality data are always reflected on the website without manual intervention.

Airtable's flexibility also enabled CRC to implement complex calculations and logic directly into their data model, generating station predictions on the fly as new data is uploaded. These calculated fields automatically update as new data are committed to the database, providing real-time recreational safety assessments based on EPA water quality standards for primary and secondary contact recreation.
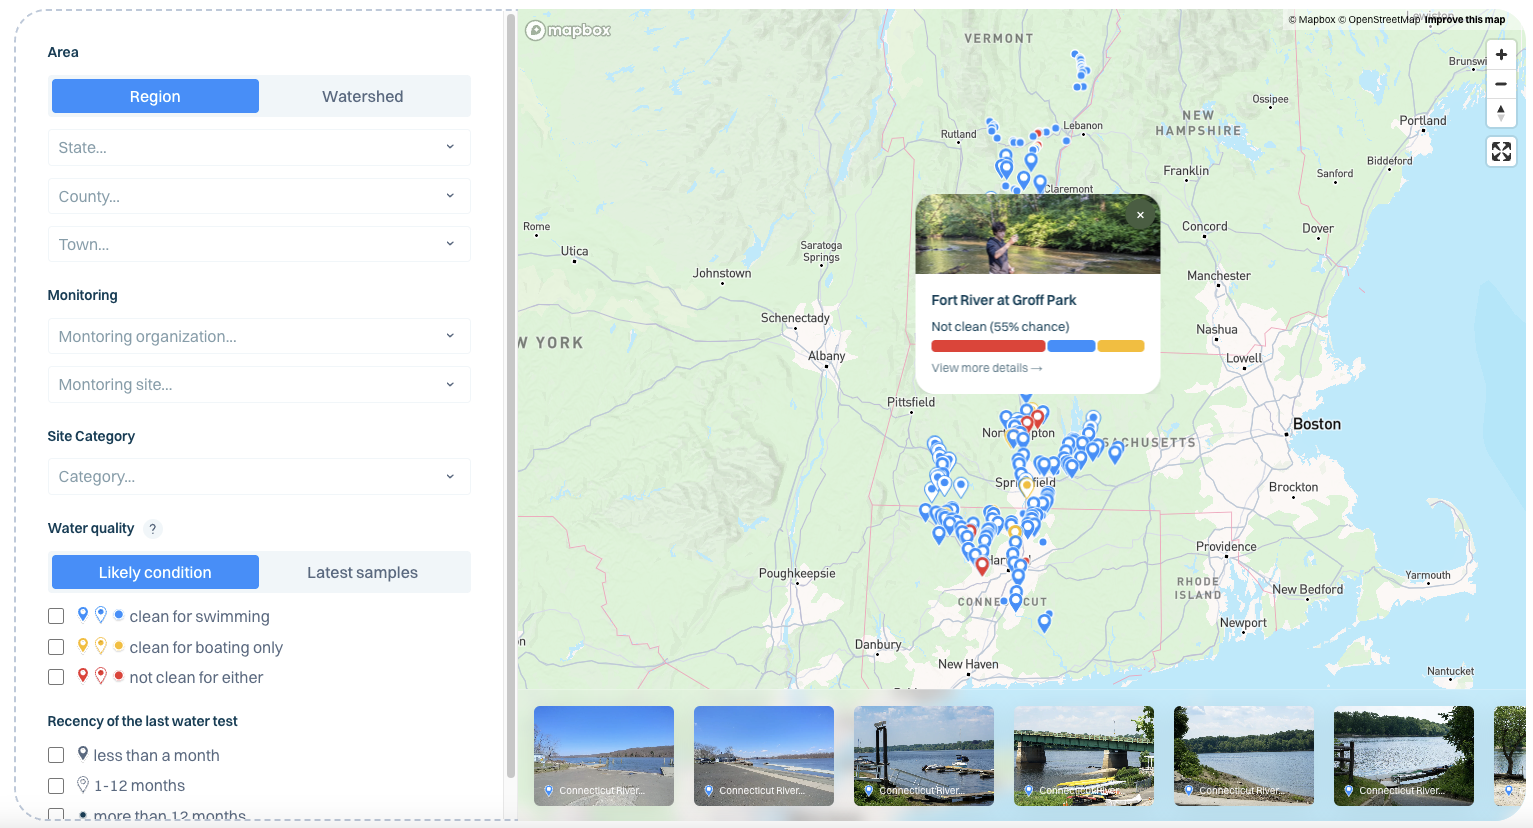
A core component of our methodology involved creating a highly responsive and user-friendly mapping experience that would cleanly fold into the Is It Clean Interface. We selected Mapbox for its superior developer and design ergonomics as well as its seamless integration capabilities with Webflow. The primary map enables users to quickly filter and view the latest site predictions to immediately determine swimming and boating conditions across the watershed. Additionally, each partner organization receives their own unique page displaying organizational details alongside a customized version of the main map filtered to show only their monitoring network, allowing users to appreciate both the broad scale of the collaborative monitoring effort and focus on local water quality conditions.
Individual monitoring site pages provide comprehensive information including navigation details for public recreation sites, historical water quality trends, and integrated real-time USGS flow data. This flow information provides crucial environmental context for E. coli readings, helping users understand how high or low flow events might influence water quality conditions and make more informed decisions about water contact activities.
Throughout development cycles our team delivered comprehensive documentation and standard operating procedure to ensure long-term platform sustainability and staff independence. As SaaS offerings expand and evolve, organizations can easily lose track of the various services being used to run complex applications, creating knowledge gaps that threaten system continuity when staff transitions occur or technical issues arise. To address this challenge, we utilized Notion as our centralized documentation platform, creating a comprehensive knowledge base that documents all elements of the Is It Clean technology stack.
Our Notion-based documentation system provides CRC staff with clear, accessible guidance on how the integrated system functions, including detailed explanations of data flows between Airtable, Webflow, and Mapbox, step-by-step procedures for common administrative tasks, troubleshooting guides for typical issues, and contact information for technical support across all platforms. This documentation approach ensures that CRC staff can maintain operational independence while having immediate access to the institutional knowledge needed to keep all system elements up to date and functioning properly. By centralizing this information in Notion's collaborative environment, we created a living resource that can be updated as the platform evolves, ensuring that critical system knowledge remains accessible and current for current and future staff members.
Results and Outcomes
The result of this collaborative effort is a water quality monitoring platform that has raised the bar for for how localized community-driven monitoring data can directly inform critical recreational decision-making across vast geographic regions. The “Is It Clean” platform successfully transforms complex laboratory E. coli readings into immediate public health guidance, serving over 2.4 million watershed residents across four states while showcasing the power of volunteer-driven environmental monitoring. This comprehensive digital infrastructure has created a seamless workflow connecting dozens of community organizations, hundreds of volunteers, and thousands of recreational users through three core connected software components working in unison to collect, manage, and visualize water quality data across the Connecticut River watershed.
Establishing a replicable model for community-based recreational water quality guidance
The primary achievement of the “Is It Clean” platform lies in its demonstration that community monitoring programs are essential extensions of state and federal agency networks, providing a much more comprehensive and localized view of current water quality conditions than traditional regulatory monitoring alone. While federal and state agencies typically monitor compliance with broad water quality standards at limited locations, the community-driven approach enables real-time recreational safety assessments at 250+ specific swimming and boating sites where families actually recreate. This granular, user-centered monitoring fills critical information gaps that regulatory agencies cannot practically address, creating an unprecedented network of water quality intelligence that directly serves public health and recreational decision-making.
The platform has proven particularly valuable in translating EPA recreational water quality standards into actionable guidance for non-technical users, bridging the gap between regulatory compliance data and practical family safety decisions. By leveraging the dedication of local

volunteer groups who understand their specific waterways and recreation patterns, the “Is It Clean” system creates a sustainable model for community organizations nationwide seeking to provide real-time water quality guidance to their constituencies. This approach recognizes that effective public health communication requires both scientific rigor and deep local knowledge, combining laboratory precision with community expertise to deliver information that recreational users actually need.
Sustainable infrastructure built for long-term organizational independence
A critical outcome of the project's hybrid SaaS approach is the creation of a highly customized platform that maintains long-term sustainability and organizational independence. By building the system around interconnected low/no-code services rather than fully custom development, CRC gains access to sophisticated functionality while maintaining the flexibility to operate and modify the platform with staff possessing low to moderate proficiency in data management and technology. The structured, machine-readable data architecture backed by Airtable's API enables programmatic access for other applications and users, creating opportunities for expanded use cases while ensuring data remains accessible and interoperable.
This infrastructure design represents a significant advance over traditional custom development approaches that often lock organizations into specific vendors or require ongoing full-stack engineering support. Instead, CRC staff can efficiently manage daily operations, make content updates, and even implement new features through intuitive interfaces, only engaging higher-capacity engineers or designers when they choose to pursue major platform expansions. The modular nature of the system means individual components can be upgraded or replaced as technology evolves, protecting CRC's investment while ensuring the platform can adapt to future needs.
The “Is It Clean” platform demonstrates that environmental organizations can access enterprise-level functionality through strategic use of modern SaaS tools, creating sustainable digital infrastructure that grows with organizational capacity rather than constraining it. This approach has established a replicable framework for community organizations seeking to transform complex environmental data into accessible public resources, proving that sophisticated public health communication tools are achievable for organizations of all sizes when approached with appropriate technical strategy and community-centered design principles.
Support the Digital Services Program
.svg)

.svg)